Miami, Meetings and Market Findings
It’s hard to believe that my month long trip to the US is coming to an end! Miami was the perfect final destination to attend my last conference and start scaling down my meetings. With the options roundabout only 2 weeks away (the end of ICURe), it’s important to take time to collate my market findings and start to think about what they mean for my business.
In this blog post, I’m going to briefly share my experience at the Disaster Expo Conference in Miami South Beach before discussing this weeks ICURe training which was all about ‘How to quantify what the market tells you‘. As always, the ICURe online training sessions are perfectly timed to suit where we are on our exploration journeys. With my head now spinning with market findings, new connections and a ton of information, it’s critical that I capture the key findings and make sure none of my 100 conversations were wasted.
But first the conference! Well the Disaster Expo was definitely the most unusual conference I’ve been to so far and It made for a refreshing break from all the healthcare focused ones I’ve been attending. The conference brought together industry leaders, government agencies and private companies working in disaster preparedness, response and recovery. So it goes without saying that the range of exhibitors was incredible! I found myself being much more interested in the ‘Disaster drones’ (see below!) and ’emergency dog responder’ demos, than the disaster health tech displays! With that said, I was able to connect with some incredible organisations delivering health equipment and life-saving technologies to war zones and disaster areas across the world. The conference really opened my eyes to an entirely new sector and my mind was racing with new ideas and applications for the digital health technologies I’ve spent the last 5 years working on at the University of Bristol.

One of my favourite parts of ICURe has been joining the Monday catch up and training session calls on Zoom. This may sound surprising (surely my world travels have been the highlight!?), but each week no matter where everyone is in the world and no matter what local time it is, all the entrepreneurial leads on the programme and their mentors join an online catch up call. Market exploration and conference travel can sometimes feel lonely, so having this weekly catch up with all of my colleagues is incredible motivation and has allowed me to feel a part of 11 other ICURe journeys as well as my own. This week I tuned in from Miami at 8am local time, this was much better than the 5am call I had last week from Vegas! Others were tuning in from Fresno, Tokyo, Amsterdam, Paris and Austin, Texas – so there were a lot of exciting updates!!


How to quantify what the market tells you
This weeks training session was all about learning how to interpret our findings and apply them to our businesses. We started off by learning about how to quantify our markets. There are many different ways to do this, some people start by taking a top down approach and simply looking up the figures for the global total market size. However, there are multiple issues with this approach, if I say the global AI market size is valued at around $244 Billion dollars, does that mean that my AI clinical decision support tool developed for critical care could earn me a whopping $244 Billion one day if I dominate the entire market!? Well, I wish, but of course not – that number has nothing to do with the reality of my customers, context, or the problem I’m solving.
Instead, the real challenge is to break your market down as much as possible (segmentation) until you reach something specific, realistic and achievable. As Stephen Meyers, one of our ICURe mentors, pointed out there’s no use in throwing out a huge figure and then claiming “we’ll capture 1% of this”, as that very quickly becomes meaningless and undermines your credibility. Market segmentation forces you to define exactly who your customers are, where they are, and how many of them exist. For example, rather than saying “we’ll take 1% of the healthcare AI market,” a better approach is to say there are 202 NHS Trusts in the UK and 210 ICU units. From these, we are going to target 30 of them in our first year of business and we already have established relationships with 12. That level of detail not only grounds your plan in reality, it also gives investors and partners confidence that you know your space and have a clear route to market.
Moving on from market size, another way of quantifying your market and also future revenue, is to quantify the value that you are offering. This isn’t about vague global figures, it’s about asking: what problem are you solving, and how much does that problem cost the people you’re trying to sell to? For example, If I can show that my solution saves an NHS Trust £X million/per year by reducing discharge delays, freeing up beds, or improving staff efficiency, then I’ve got something far more compelling than a broad market number. This helps anchor your business in real impact, and it also helps you build (and justify) a pricing model that makes sense for both you and your customers.
So how do you go about quantifying your value? Well at the very beginning of ICURe, we were tasked with designing customer tests to challenge our assumptions. One of mine was that clinicians would benefit from easier access to multiple data sources to support decision making. To test this, I spoke to 10 clinicians from different hospitals and asked how they currently accessed patient data, and whether it was all in a centralised system. If more than seven said their data was spread across multiple systems and difficult to access, I would take that as confirmation of the assumption. From there, I could move on to the next test, whether people would pay to solve this problem. So when a clinician described using multiple systems, I asked if they had tried to address it before, or if it caused delays in decision making. That’s when I started to gather much more detailed insights into how clinicians worked with their data, the knock-on effects on time and efficiency, and critically, whether they were motivated to solve it. I also then started to find out key information from my users such as “yes, we bought a platform last year for £100k but we didn’t have the IT support to implement it so it never really worked”. Suddenly I was learning 1. How much my customers were spending on solving this problem 2. Why the current existing solutions were failing. Getting to this level of detail in a conversation can be difficult and it takes practise but it’s incredibly valuable and was critical in helping me quantify the value my product and how much my customers were willing to pay for it.
This bottom up approach definitely requires a lot more work and time but as I now begin sifting through all my notes and voice recordings from my 100 conversations over the past 10 weeks, I’m hugely grateful that I had these tests and assumptions in the back of my head throughout the entire journey as I can now piece together a realistic picture of the market size, my segments, the realistic addressable market and I have evidence of my customers behaviours and priorities. All of this put together, builds a much more compelling case for investors to trust that you understand the market and have an achievable and actionable route in.
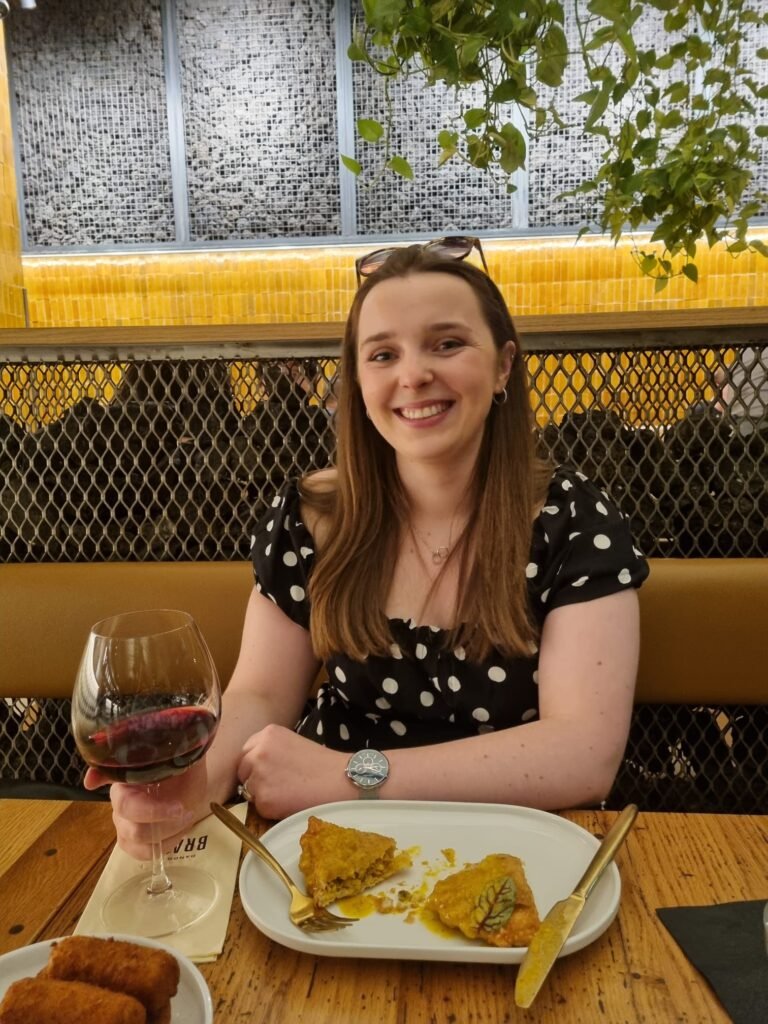
And that’s a wrap on the US leg of the tour! I finished off my final day in Miami, and my last day of travelling altogether, with a relaxing day by the pool and a lovely dinner in Miami city centre. Now it’s time to face the music as I head home and prepare for Pitch Training in Southampton and of course…the Options Roundabout!! Thanks for reading and I’ll see you in the next one!


